Ironman Oceanside 70.3: 2024 Race Statistics
As always – some numbers related to athletes:
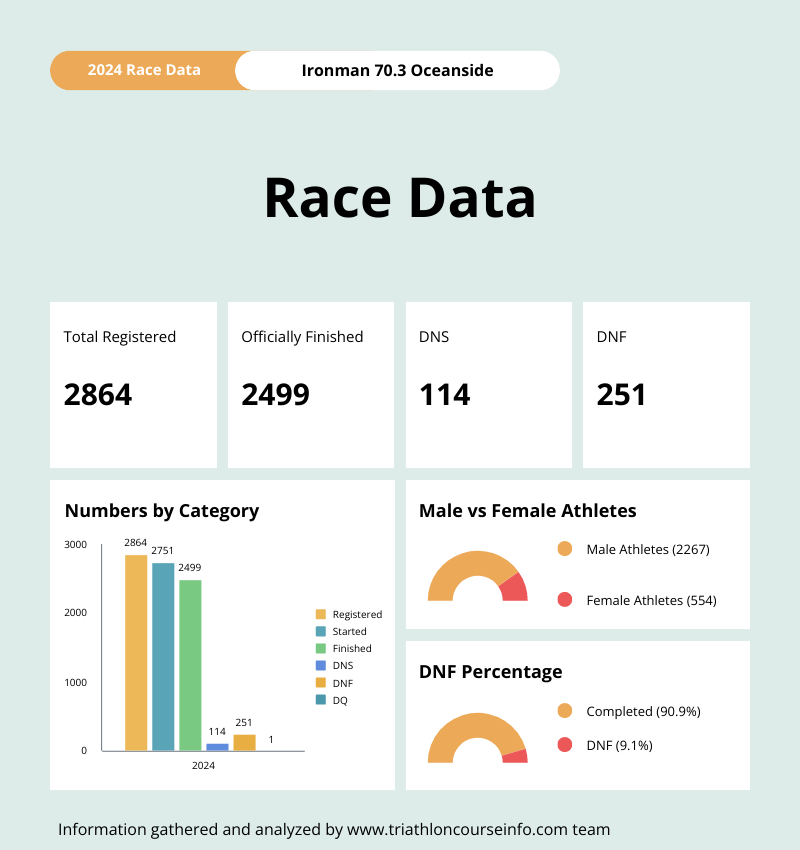
- 2864 athletes registered.
- 2751 started the race.
- 2499 crossed that finish line!
- 251 DNFs, 114 DNSs, 1DQ.
- DNF rate – 9.1%.
- Male PRO – 71
- Female PRO – 31
Ironman athlete status categories are defined as follows:
- DNF (Did Not Finish): This includes athletes who started the event but were unable to cross the finish line, or who crossed the finish line after the course had officially closed.
- DNS (Did Not Start): These are athletes who, despite registering for the event, failed to start the race.
- DSQ (Disqualified): This category comprises those who started the event but were subsequently disqualified for various reasons.
- NC (Not Classified): Athletes in this group started the event and crossed the finish line before the course closed but did not meet certain established course or discipline cut-off times, or the overall event course cut-off.
Bike course and Run Course Review
Okay, as always – time to review elevation gain data after the race. I wanted to know more than just who won, so I did a deep dive on Strava.
As always – randomly picked 20 athletes who did the race and stalked their profiles (don’t judge, we all do it). I wanted to see the course elevation, what kind of gear they used, basically get inside their heads a bit. To equally represent all athletes – I’ve selected 10 male and 10 female athletes across most of the age groups.
Bike course and Run Course Data Table
Bike Course Elevation (m) | Run Course Elevation (m) | Device |
|---|---|---|
738 | 93 | Garmin Edge 530 / Garmin Forerunner 645 Music |
831 | 135 | Garmin Edge 840 / Garmin Forerunner 745 |
780 | 126 | Garmin Edge 530 / Garmin Forerunner 935 |
818 | 125 | Garmin Edge 520 / Garmin Forerunner 955 |
763 | 103 | Garmin Edge 530 / Garmin Forerunner 965 |
682 | 103 | Garmin Edge 520 Plus / Garmin Forerunner 955 |
783 | 100 | Garmin epix Pro (Gen 2) |
840 | 140 | Garmin Forerunner 935 |
763 | 103 | Garmin Edge 530 / Garmin Forerunner 965 |
747 | 103 | Garmin Edge 530 / Garmin Forerunner 745 |
970 | 100 | Garmin Edge 130 Plus / Garmin Forerunner 745 |
863 | 162 | Garmin Forerunner 965 |
1128 | 133 | Garmin fēnix 6 Pro |
1018 | 182 | Garmin fēnix 7 |
8 | 122 | Garmin Edge 520 / Garmin Forerunner 745 |
890 | 128 | Garmin Forerunner 965 |
1002 | 136 | Garmin fenix 6S Pro |
713 | 90 | Garmin Venu 2S |
819 | 125 | Garmin Forerunner 955 |
746 | 99 | Garmin Forerunner 245 |
Ironman Oceanside 70.3: Summary of the Elevation Gain Analysis
I have verified the official bike course elevation as 829 meters, as declared by the event organizers. To supplement this data, I analyzed a sample of 20 random Strava profiles. The gathered elevation figures ranged from 682 meters to 1128 meters. Given the absence of significant outliers, all results were incorporated into the calculation of average elevation gain.
As average bike course elevation gain calculated using my gather data is 835 meters – results is very close to officially declared.
The organizers provided an official run course elevation of 84 meters. Interestingly, this data exhibits minimal variation. A review of Strava profiles confirmed this, with results falling within a range of 90 to 182 meters. Consequently, all run results will be utilized to compute the average run course elevation gain.
Average run course elevation data calculated as 120 meters, which is very close to the data provided by organizers.
Bike Course Elevation:
- Average Elevation: 835 meters
Run Course Elevation:
- Average Elevation: 120 meters
More information
To find more information about the course, air temperature, water temperature, number of laps and more, please visit dedicated Ironman Oceanside 70.3 course information page.
Check out the course maps below – they’ve got all the ups and downs you need to strategize your way to a podium finish (or, you know, just survive the race).


