Ironman New Zealand 70.3 and 140.6: 2024 Race Review
As both Ironman New Zealand races – 70.3 and 140.6 – took place on the same date, instead of creating two separate review, it will be combined into one blog post with 70.3 event getting more attention in terms of analyzed data and infographics.
Part1. Ironman New Zealand 70.3: 2024 Race Review
The Ironman 70.3 New Zealand, held in Taupo on March 2, 2024, saw a significant gathering of athletes with 850 registrants. Of these:
697 athletes successfully completed the race within the permitted time, showcasing their endurance and determination.
The event had a diverse participation, with 491 males and 276 females crossing the start line, highlighting the inclusive nature of this event.
In the male category, Thomas Williams from New Zealand distinguished himself by securing the top spot, demonstrating exceptional performance. On the women’s side, Merle Talviste from Estonia emerged as the overall winner.
The race’s outcome, with 47 athletes unable to finish (DNF), 82 not starting (DNS), 23 not classified, and 1 not yet started (NYS), reflects the demanding nature of Ironman competitions.

These categories are defined as follows:
- DNF (Did Not Finish): This includes athletes who started the event but were unable to cross the finish line, or who crossed the finish line after the course had officially closed.
- DNS (Did Not Start): These are athletes who, despite registering for the event, failed to start the race.
- DSQ (Disqualified): This category comprises those who started the event but were subsequently disqualified for various reasons.
- NC (Not Classified): Athletes in this group started the event and crossed the finish line before the course closed but did not meet certain established course or discipline cut-off times, or the overall event course cut-off.
Bike course and Run Course Review
To gain deeper insights into the Ironman race held in Taupo, we conducted a focused review of publicly available data on Strava.
This involved a random selection of 20 athlete profiles that participated in the event. Our analysis centered on specific aspects of their performance, namely the elevation details of both the bike and run courses. Additionally, we paid close attention to the types of devices used by these athletes to record their data.
This approach allowed us to understand not only the physical demands of the course through elevation changes but also the technology preferences among the participants for tracking their performance.
Bike course and Run Course Data Table
Bike Course Elevation (m) | Run Course Elevation (m) | Device |
|---|---|---|
520 | 148 | Garmin Forerunner 955 |
544 | 159 | Garmin Forerunner 745 |
485 | 163 | Garmin Edge 830 / Garmin fenix 7x |
463 | 179 | Garmin Edge 520 Plus / Garmin fenix 7x |
465 | 165 | Garmin Edge 530 / Garmin Forerunner 955 |
620 | 151 | Garmin Forerunner 745 |
454 | 123 | Garmin Edge 540 / Garmin Forerunner 935 |
466 | 144 | Garmin Edge 530 / Garmin Forerunner 255 Music |
486 | 226 | Garmin Edge 530 / Garmin Forerunner 955 |
570 | 151 | Garmin Forerunner 945 |
391 | 150 | Wahoo ELEMNT BOLT / Garmin fenix 6S Pro |
590 | 0 | Garmin Edge 130 Plus / Garmin Forerunner 955 |
725 | 151 | Garmin fenix 6S Pro |
525 | 164 | Garmin Forerunner 945 |
511 | 200 | Garmin Forerunner 955 |
742 | 145 | Garmin fenix 6X |
498 | 160 | Garmin Edge 830 / Garmin fenix 6X |
498 | 316 | Garmin Edge 540 / Garmin Forerunner 945 |
578 | 531 | Garmin Forerunner 935 |
501 | 111 | Garmin Edge 520 / Garmin Forerunner 265 |
Ironman New Zealand 70.3: Summary of the Analysis
Here is a summary of the analysis of the data from the 20 randomly selected Ironman 70.3 New Zealand athletes. All randomly selected profiles included both genders and different age group triathletes.
There is no elevation gain for the Ironman New Zealand 70.3 bike course provided by the race organisers, therefore we had to rely on data gathered through review of participants Strava profiles. Almost all bike course elevation results are scattered across similar range and only two results stands out as outliers – 725 meters and 742 meters of elevation gain. These results were recorded using Garmin Fenix 6S PRO and Garmin Fenix 6X watches.
When it comes to Ironman New Zealand 70.3 run course elevation recordings –we found two recorded elevation results that sits on both sides of the spectrum and can be considered significant outliers. Again, there is no officially declared elevation gain for Ironman New Zealand 70.3 run course provided and we had to rely on data gather from participants Strava profiles. 0 meters of elevation gain has been recorded by Garmin Forerunner 955 watch. One of possible contributing factors and most probable cause could be a malfunctioning device. Second result that we consider as significant outlier is 531 meters of elevation gain recorded using Garmin Forerunner 935 sport watch. As this is almost three times of average result – it will be excluded from average calculation.
Bike course and run course outliers will be excluded from Mean (average) elevation gain calculation to get more accurate results, however will be included in Median, Minimum and Maximum results.
Bike course Elevation: Garmin Edge vs Sport Watches
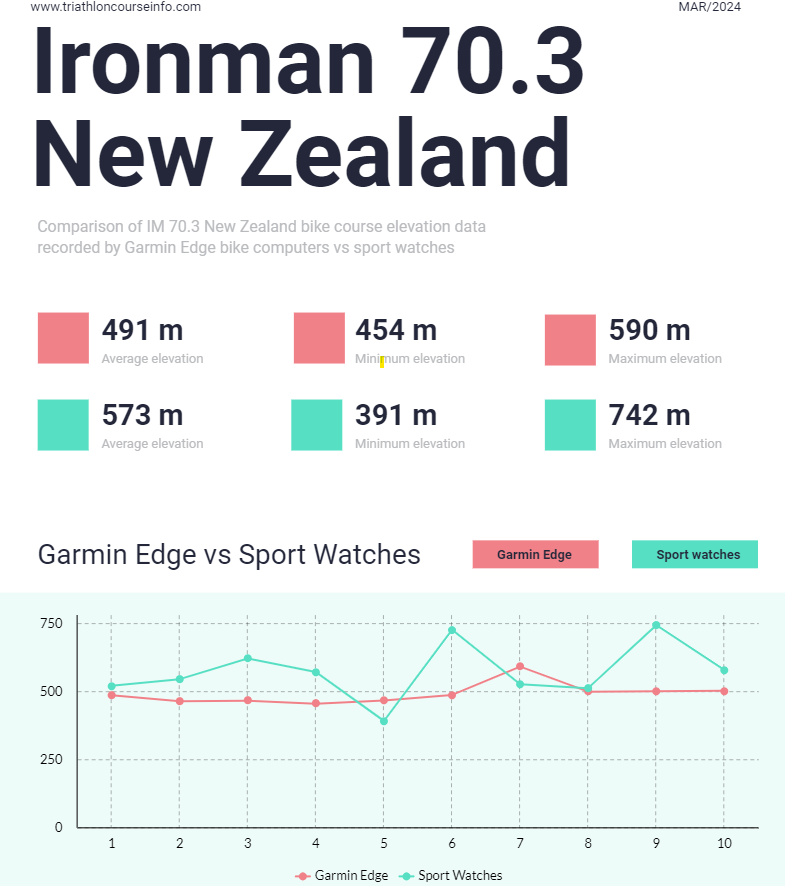
In analyzing the elevation data from the Ironman New Zealand 70.3 bike course, it was observed that half of the 20 athletes utilized Garmin Edge bike computers, while the other half relied on sports watches. This prompted a comparative analysis of the elevation gains recorded by the two device types.
The data from the Garmin Edge devices displayed minimal variation, with most results clustering closely together, except for a slightly higher elevation gain of 590 meters, which didn’t markedly deviate from the other figures. On the other hand, the sports watch data exhibited more significant fluctuations, with a substantial 351-meter disparity between the highest and lowest elevation gains, but only 136-meter range observed with the Garmin Edge devices.
Moreover, the average elevation gain measured by the sports watches was 573 meters, noticeably higher than the 491 meters averaged by the bike computers. Although the overall elevation gains recorded by both device types didn’t show a substantial difference, the Garmin Edge bike computers demonstrated a more consistent and uniform set of results compared to the more varied outcomes from the sports watches.
Bike Course Elevation:
- Average Elevation: 509 meters
Run Course Elevation:
- Average Elevation: 167 meters
More information
To find more information about the course, air temperature, water temperature, number of laps and more, please visit dedicated Ironman New Zealand 70.3 page
Ironman Zealand 70.3: Bike Course 2024
Ironman Zealand 70.3: Run Course 2024
Part2. Ironman Zealand 140.6: 2024 Review
The Ironman New Zealand, took place in Taupo on March 2, 2024 and attracted over 974 registrants. Of these:
772 athletes successfully completed the race within the permitted time, showcasing their endurance and determination.
The event had a diverse participation, with 684 males and 185 females crossing the start line, highlighting the inclusive nature of this event.
In the male PRO category, Stephen McKenna distinguished himself by securing the top spot, demonstrating exceptional performance. On the women’s PRO side, Chelsea Sodaro emerged as the overall winner.
The race’s outcome, with 94 athletes unable to finish (DNF), 105 not starting (DNS), 2 not classified, and 1 disqualified (DQ), reflects the demanding nature of Ironman competitions.
Bike course and Run Course Review
To gain deeper insights into the Ironman race held in Taupo, we conducted a focused review of publicly available data on Strava.
This involved a random selection of 20 athlete profiles that participated in the event. Our analysis centered on specific aspects of their performance, namely the elevation details of both the bike and run courses. Additionally, we paid close attention to the types of devices used by these athletes to record their data.
This approach allowed us to understand not only the physical demands of the course through elevation changes but also the technology preferences among the participants for tracking their performance.
Bike course and Run Course Data Table
Bike Course Elevation (m) | Run Course Elevation (m) | Device |
|---|---|---|
995 | 308 | Garmin Edge 830 / Garmin Forerunner 945 |
1307 | 295 | Garmin fenix 6 Pro |
911 | 940 | Garmin Edge 520 Plus / Garmin fenix 5X |
1718 | 438 | Garmin Epix Gen2 |
981 | 302 | Garmin Edge 530 / Garmin Forerunner 255 |
1988 | 306 | Garmin fenix 6X |
1307 | 294 | Garmin Forerunner 955 |
948 | 305 | Garmin Edge 530 / Garmin Forerunner 945 |
1204 | 339 | Garmin Forerunner 955 |
1414 | 343 | COROS PACE 3 |
1120 | 310 | Garmin Forerunner 955 |
310 | 0 | Garmin fenix 6X |
1399 | 370 | Garmin fenix 6S Pro |
1128 | 710 | Garmin fenix 6S Pro |
1172 | 402 | Garmin Forerunner 945 |
988 | 229 | Garmin fenix 6X |
1114 | 280 | Garmin Forerunner 955 |
1057 | 228 | Garmin Edge 540 / N/A |
667 | 269 | Garmin Edge 530 / Garmin fenix 6X |
819 | 302 | Garmin Edge 530 / Garmin fenix 6 Pro |
Ironman New Zealand 140.6: Summary of the Analysis
Here is a summary of the analysis of the data from the 20 randomly selected Ironman New Zealand 140.6 athletes. All randomly selected profiles included both genders and different age group triathletes.
There is no elevation gain for the Ironman New Zealand 140.6 bike course provided by the race organisers, therefore we had to rely on data gathered through review of participants Strava profiles. Almost all bike course elevation results are scattered across similar range and only one results stands out but it’s not significant to be considered outliers – 1988 meters of elevation gain recorded with Garmin Fenix 6X watch.
When it comes to Ironman New Zealand 70.3 run course elevation recordings –we found two elevation results that can be considered significant outliers. Again, there is no officially declared elevation gain for Ironman New Zealand 70.3 run course provided and we had to rely on data gather from participants Strava profiles. Both outliers are on higher side of the results – 710 meters and 940 meters of elevation gain and were recorded suing Garmin Fenix 6s Pro and Garmin Fenix 6 Pro devices respectively. As both results are almost twice and 3 times of average result – it will be excluded from average calculation.
Note: bike course and run course outliers will be excluded from Mean (average) elevation gain calculation to get more accurate results, however will be included in Median, Minimum and Maximum results.
Bike Course Elevation:
- Mean Elevation: 1168 meters
- Minimum Elevation: 667 meters
- Median Elevation: 1117 meters
- Maximum Elevation: 1988 meters
Run Course Elevation:
- Mean Elevation: 313 meters
- Minimum Elevation: 228 meters
- Median Elevation: 307 meters
- Maximum Elevation: 940 meters
Devices
- The most frequently used device in this race for the bike segment was “Garmin Edge 530”.
- For the run segment, “Garmin Forerunner 955” was also most common device used to track activity.
More information
To find more information about the course, air temperature, water temperature, number of laps and more, please visit dedicated Ironman New Zealand page